


Engineering Guide · v2.4
Telemetry &
Observability Pipelines
A comprehensive walkthrough of building production-grade pipelines that collect, process, route, and analyze signals across distributed systems.
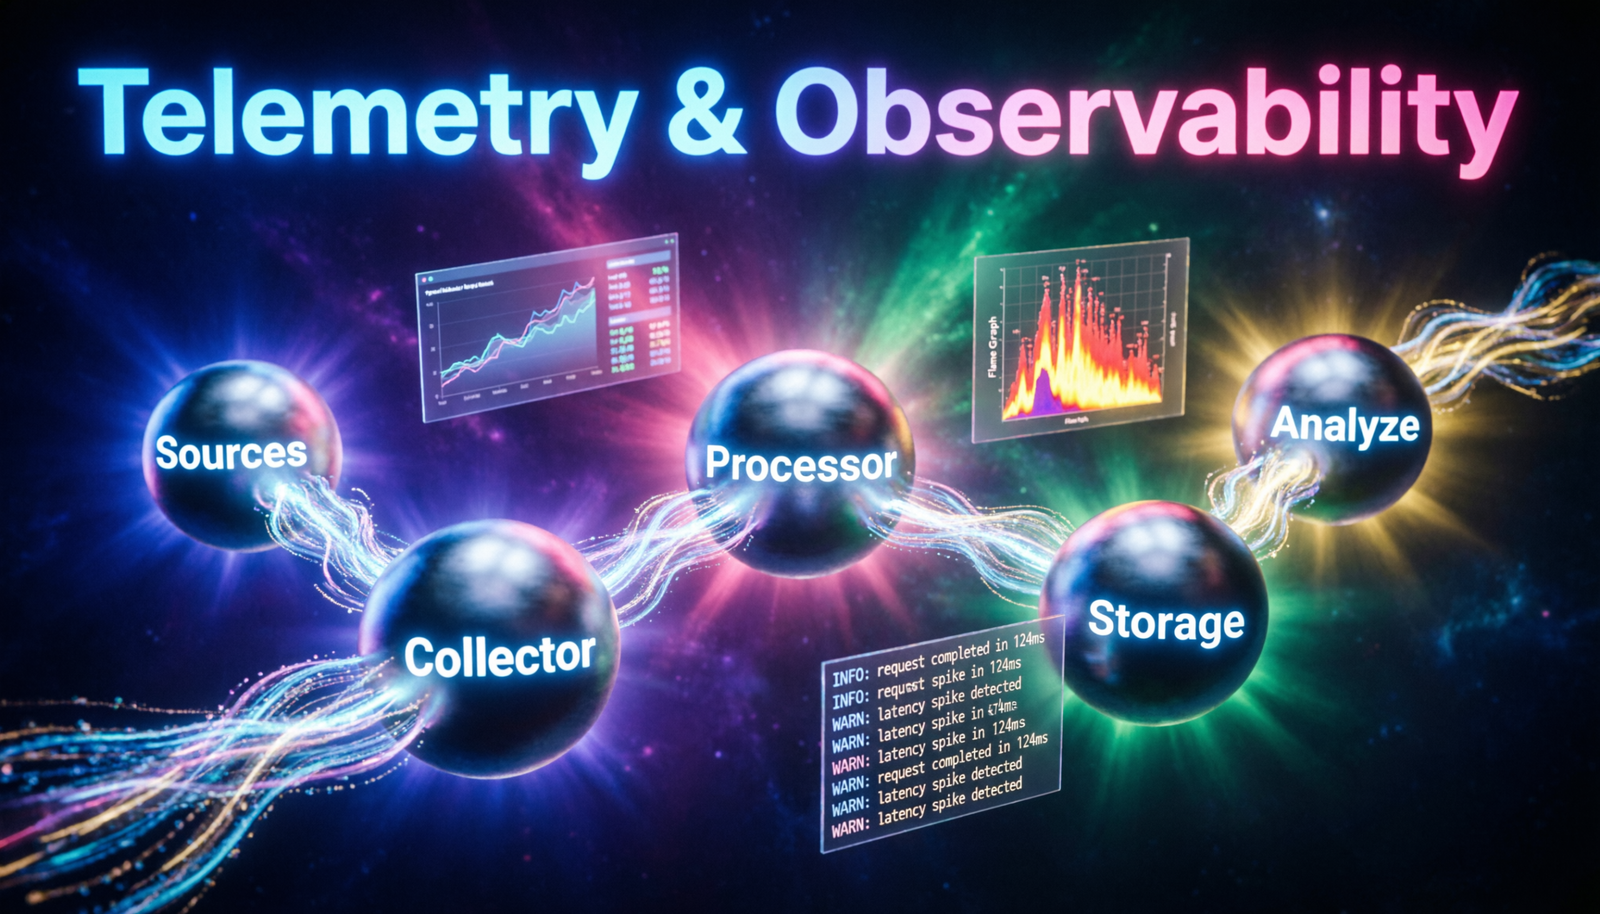
// data flow overview
📡
Sources
emit signals
──▶
🔗
Collector
OTel agent
──▶
⚙️
Processor
transform
──▶
🗄️
Storage
persist
──▶
📊
Analyze
query & alert
3
Signal Types
P99
Latency SLO
5×
Cardinality Limit
99.9%
Pipeline Uptime
<2s
Ingestion Lag
Core Concepts
// three pillars of observability
Metrics
Numeric measurements collected at regular intervals. Use counters, gauges, and histograms to track throughput, saturation, and error rates across services.
Traces
Distributed trace context propagated across service boundaries via W3C TraceContext. Reconstruct request journeys and pinpoint latency bottlenecks at span granularity.
Logs
Structured, timestamped event records enriched with trace IDs for correlation. Centralise with a semantic logging schema to enable cross-service queries.
OpenTelemetry
Vendor-neutral instrumentation SDK and collector. Instrument once, export to Prometheus, Jaeger, Datadog, Grafana Cloud — or all simultaneously via fan-out exporters.
Sampling
Tail-based sampling keeps high-value traces (errors, slow requests) while discarding routine traffic. Reduce storage costs by 80–95% without sacrificing signal fidelity.
Alerting
Define SLOs with burn-rate alerts on multi-window, multi-burn-rate rules. Route severity tiers to PagerDuty, Slack, or incident management platforms via Alertmanager.
OTel Collector Config
// otelcol-contrib · config.yaml
otel-collector/config.yaml
# ── Receivers ─────────────────────────────────────────
receivers:
  otlp:
    protocols:
      grpc: { endpoint: "0.0.0.0:4317" }
      http: { endpoint: "0.0.0.0:4318" }
  prometheus:
    config:
      scrape_configs:
        - job_name: "services"
          scrape_interval: "15s"
          static_configs:
            - targets: ["api:8080", "worker:9090"]

# ── Processors ────────────────────────────────────────
processors:
  batch:
    timeout: "1s"
    send_batch_size: 1024
  tail_sampling:
    decision_wait: "10s"
    policies:
      - { name: "errors",     type: "status_code", status_code: { status_codes: ["ERROR"] } }
      - { name: "slow-spans", type: "latency",     latency:      { threshold_ms: 500 } }
      - { name: "sample-10",  type: "probabilistic", probabilistic: { sampling_percentage: 10 } }
  resource:
    attributes:
      - { action: "upsert", key: "deployment.env", value: "production" }

# ── Exporters ─────────────────────────────────────────
exporters:
  otlp:
    endpoint: "tempo.monitoring.svc:4317"
    tls: { insecure: false }
  prometheusremotewrite:
    endpoint: "https://mimir.internal/api/v1/push"
  loki:
    endpoint: "http://loki.monitoring.svc:3100/loki/api/v1/push"

# ── Pipelines ─────────────────────────────────────────
service:
  pipelines:
    traces:   { receivers: ["otlp"], processors: ["tail_sampling", "batch"], exporters: ["otlp"] }
    metrics:  { receivers: ["otlp", "prometheus"], processors: ["batch", "resource"], exporters: ["prometheusremotewrite"] }
    logs:     { receivers: ["otlp"], processors: ["batch"], exporters: ["loki"] }
Implementation Phases
// roll out in stages, validate each layer
Instrument Services
Add OTel SDK to each service. Auto-instrument HTTP, gRPC, DB, and queue clients. Emit spans with semantic attribute conventions (http.method, db.system, etc.).
Deploy Collectors
Run a sidecar or DaemonSet collector per node. Use a gateway collector tier for fan-out routing, sampling decisions, and secret management.
Persist Signals
Write traces to Tempo, metrics to Mimir/Prometheus, logs to Loki. Use object storage backends (S3/GCS) for cost-effective long-term retention.
Build Dashboards
Create Grafana dashboards with RED method panels per service. Link trace exemplars from metric graphs for one-click drill-down into distributed traces.
Define SLOs
Encode availability and latency SLOs as Prometheus recording rules. Configure multi-window burn-rate alerts with tiered severity routing via Alertmanager.
Continuously Improve
Review alert noise weekly. Tune sampling policies based on storage cost vs. coverage. Validate pipeline health with synthetic canary transactions.
Bestseller #3