


Key Metrics for
Model Evaluation
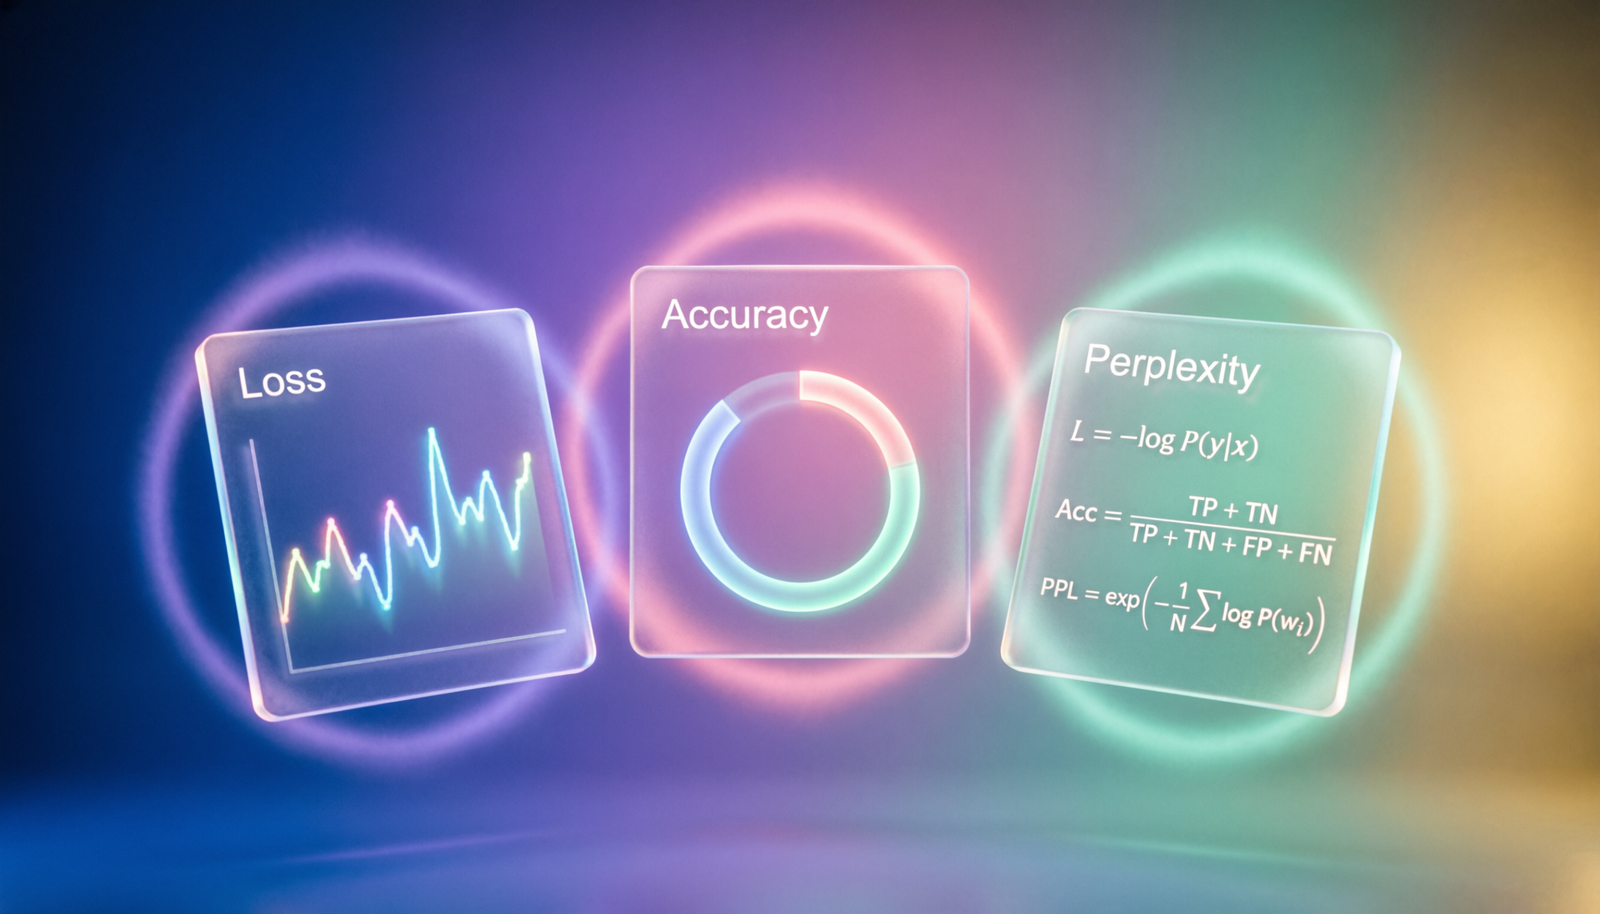
Understanding Loss, Accuracy, and Perplexity — the three pillars that tell you how well your model is actually learning.
Loss
Quantifies the penalty for wrong predictions. Lower loss means the model’s outputs are closer to ground truth — the primary signal used during training to update weights via backpropagation.
Accuracy
The fraction of predictions the model gets right. Simple and intuitive, but can be misleading on imbalanced datasets where one class vastly outnumbers the others.
Perplexity
Measures how “surprised” a language model is by unseen text. Lower perplexity means the model assigns higher probability to real sequences — better language understanding.
📉 Loss Deep Dive
Cross-Entropy Loss
Standard for classification. Penalises confident wrong predictions heavily, encouraging well-calibrated probability outputs.
MSE / MAE Loss
Used for regression. MSE penalises large errors more; MAE treats all errors equally, making it robust to outliers.
Training vs. Val Loss
When training loss falls but validation loss rises, the model is overfitting — memorising rather than generalising.
Loss Landscape
Deep networks have non-convex loss surfaces. Optimisers like Adam navigate this with adaptive per-parameter learning rates.
🎯 Accuracy Deep Dive
Accuracy alone rarely tells the full story. Consider these complementary metrics:
When accuracy misleads
On a 99% negative dataset, always predicting “negative” gives 99% accuracy — yet has zero predictive power. Always check class distribution.
🌀 Perplexity Deep Dive
A perplexity of K means the model is as uncertain as choosing uniformly among K options at each token step. Lower is always better.
| Range | Interpretation | Typical Use |
|---|---|---|
| < 10 | Excellent — strongly predicts next tokens | Fine-tuned domain LLMs |
| 10 – 50 | Good — fluent, coherent generation | GPT-4, Claude, Gemini |
| 50 – 200 | Fair — occasional incoherence | Smaller / early-stage models |
| > 200 | Poor — model struggles with the domain | Out-of-distribution text |
⚖️ Side-by-Side Comparison
| Metric | Direction | Task Type | Key Limitation |
|---|---|---|---|
| Loss | ↓ Lower is better | All tasks | Not always human-interpretable |
| Accuracy | ↑ Higher is better | Classification | Misleading on imbalanced data |
| Perplexity | ↓ Lower is better | Language modelling | Depends on tokenisation scheme |