


Deploy Your Model
to Production
From Notebook to Production System
The architecture decisions that determine whether your model succeeds in the real world
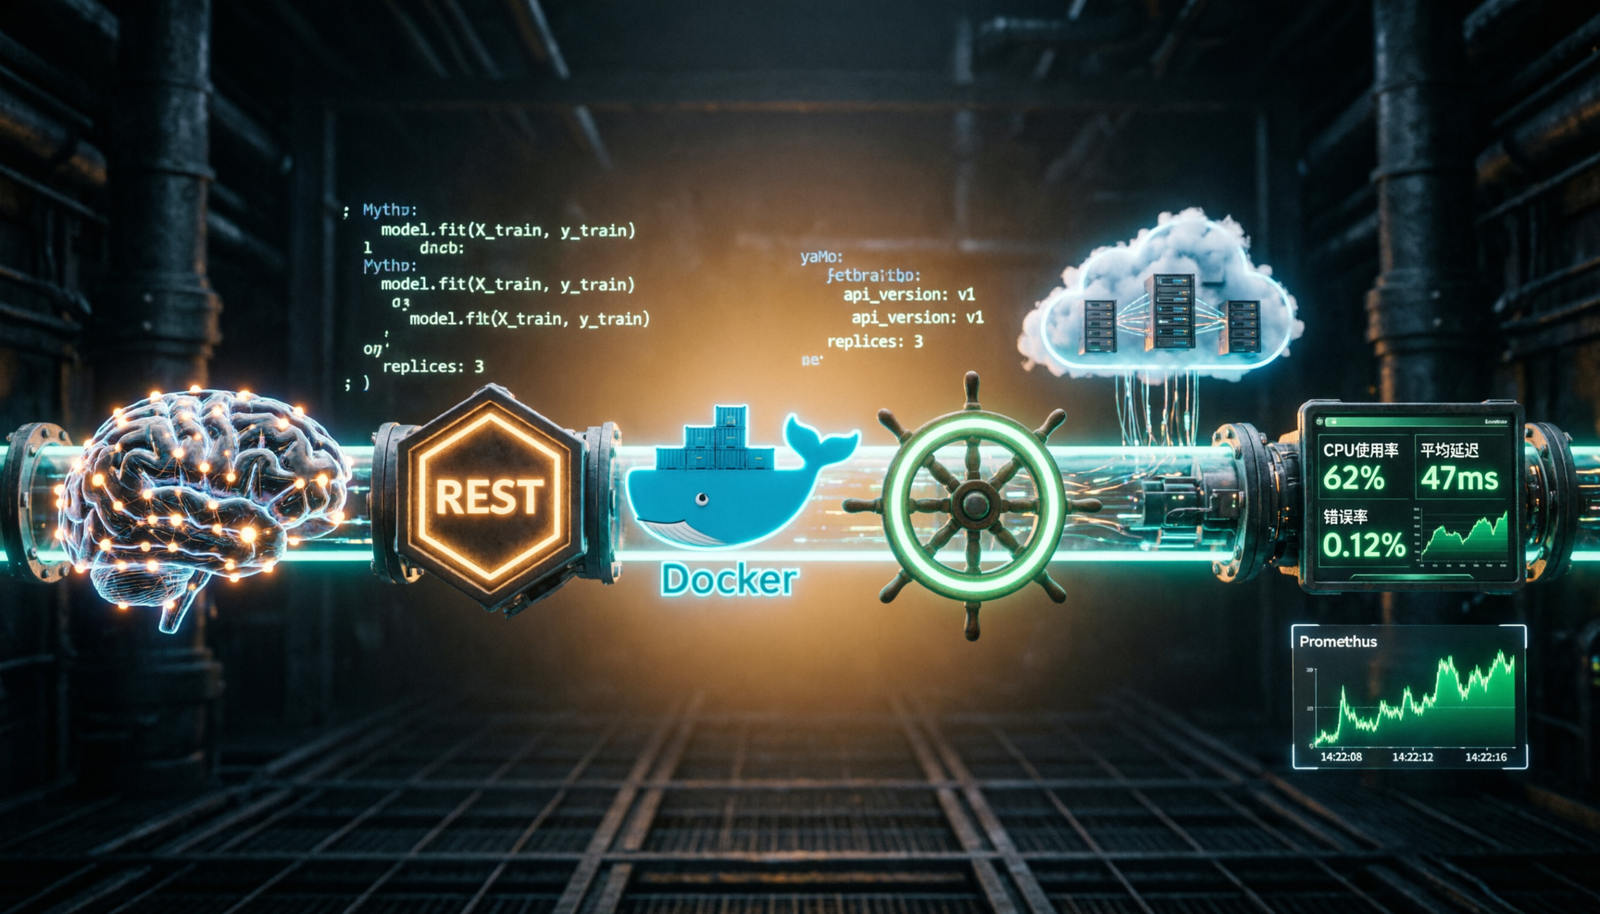
Deploying an ML model to production is fundamentally different from running experiments. A production system must handle real traffic, be observable, fail gracefully, and update without downtime. Step 8 bridges the gap between a trained model artifact and a live, reliable, scalable service.
Online Inference
Real-time predictions via REST or gRPC API. Millisecond latency required. Used in fraud detection, recommendations, and chatbots.
Batch Inference
Scheduled bulk predictions on large datasets. Ideal for nightly reports, email recommendations, and data pipeline enrichment.
Streaming Inference
Continuous predictions on event streams via Kafka or Kinesis. Used in IoT anomaly detection and real-time scoring pipelines.
Building a REST API — FastAPI Example
The standard pattern for exposing your trained model as a production service
The most common deployment pattern wraps your model in a web API. FastAPI is the modern choice — it provides async support, automatic OpenAPI docs, Pydantic validation, and excellent performance for ML workloads.
// app.py — Production FastAPI Inference Server
# Step 8: Production Model API
from fastapi import FastAPI, HTTPException
from pydantic import BaseModel
import joblib, numpy as np, time, logging
from prometheus_client import Counter, Histogram, generate_latest

# ── Prometheus Metrics ──────────────────────────
REQUEST_COUNT   = Counter('predict_requests_total', 'Total predictions')
REQUEST_LATENCY = Histogram('predict_duration_seconds', 'Latency')
ERROR_COUNT     = Counter('predict_errors_total', 'Total errors')

app = FastAPI(title="ML Model API", version="1.0.0")

# ── Load model ONCE at startup (critical!) ───────
@app.on_event("startup")
async def load_model():
    app.state.model  = joblib.load("model/classifier_v2.pkl")
    app.state.scaler = joblib.load("model/scaler.pkl")
    logging.info("✅ Model loaded")

# ── Schemas ─────────────────────────────────────
class PredictRequest(BaseModel):
    features: list[float]
    model_version: str = "v2"

class PredictResponse(BaseModel):
    prediction: int
    probability: float
    latency_ms: float

# ── Inference Endpoint ──────────────────────────
@app.post("/predict", response_model=PredictResponse)
async def predict(request: PredictRequest):
    start = time.time()
    REQUEST_COUNT.inc()
    try:
        X        = np.array(request.features).reshape(1, -1)
        X_scaled = app.state.scaler.transform(X)
        pred     = app.state.model.predict(X_scaled)[0]
        proba    = app.state.model.predict_proba(X_scaled)[0].max()
        latency  = (time.time() - start) * 1000
        REQUEST_LATENCY.observe(latency / 1000)
        return PredictResponse(
            prediction=int(pred),
            probability=round(float(proba), 4),
            latency_ms=round(latency, 2)
        )
    except Exception as e:
        ERROR_COUNT.inc()
        raise HTTPException(status_code=500, detail=str(e))

@app.get("/health")
async def health():
    return {"status": "healthy", "model": hasattr(app.state, "model")}
Containerization with Docker
Package your model and environment into a portable, reproducible container
Docker ensures “it works on my machine” becomes “it works everywhere.” Your container captures exact Python versions, dependencies, and system libraries — eliminating environment drift between development, staging, and production.
// Dockerfile — Multi-Stage Production Build
# Stage 1: Builder — install all dependencies
FROM python:3.11-slim AS builder
WORKDIR /app
COPY requirements.txt .
RUN pip install --no-cache-dir --user -r requirements.txt

# Stage 2: Minimal runtime image
FROM python:3.11-slim

# Security: run as non-root user
RUN addgroup --system mlapp && adduser --system --ingroup mlapp mlapp
WORKDIR /app
COPY --from=builder /root/.local /root/.local
COPY --chown=mlapp:mlapp . .
COPY model/ /app/model/

USER mlapp
EXPOSE 8000

ENV PYTHONUNBUFFERED=1 MODEL_VERSION=v2 LOG_LEVEL=INFO

HEALTHCHECK --interval=30s --timeout=10s --retries=3 \
  CMD curl -f http://localhost:8000/health || exit 1

CMD ["uvicorn", "app:app", \
     "--host", "0.0.0.0", "--port", "8000", "--workers", "4"]
// docker-compose.yml — Full Stack with Monitoring
version: '3.9'
services:
  ml-api:
    build: .
    ports: ["8000:8000"]
    volumes: ["./model:/app/model:ro"]
    deploy:
      resources:
        limits: { memory: 2g, cpus: '2' }
    restart: unless-stopped

  prometheus:
    image: prom/prometheus
    volumes: ["./prometheus.yml:/etc/prometheus/prometheus.yml"]
    ports: ["9090:9090"]

  grafana:
    image: grafana/grafana
    ports: ["3000:3000"]
    environment: ["GF_SECURITY_ADMIN_PASSWORD=secret"]
Cloud Platform Deployment
AWS, GCP & Azure — each with managed ML serving solutions
AWS SageMaker
Managed inference endpoints with auto-scaling. Supports real-time, async, and batch transform. Built-in A/B testing via production variants.
Vertex AI
Google’s unified ML platform with online/batch predictions, drift monitoring, and AutoML. Strong TensorFlow ecosystem support.
Azure ML
MLflow-native deployment with blue/green endpoint routing. Excellent enterprise Active Directory and compliance integrations.
// AWS SageMaker Deployment — Python SDK
import boto3
from sagemaker import Model, Session
from sagemaker.model_monitor import DataCaptureConfig

session = Session()
role    = "arn:aws:iam::123456789:role/SageMakerRole"

# 1. Upload model artifact to S3
s3_uri = session.upload_data(
    path="model/model.tar.gz",
    bucket="my-ml-models",
    key_prefix="classifier/v2"
)

# 2. Define model
model = Model(
    image_uri="763104351884.dkr.ecr.us-east-1.amazonaws.com/sklearn:1.3",
    model_data=s3_uri, role=role, name="classifier-v2"
)

# 3. Deploy with data capture for monitoring
predictor = model.deploy(
    initial_instance_count=2,
    instance_type="ml.m5.xlarge",
    endpoint_name="classifier-production",
    data_capture_config=DataCaptureConfig(
        enable_capture=True,
        sampling_percentage=20,
        destination_s3_uri="s3://my-ml-models/capture"
    )
)

# 4. Auto-scaling: 2–10 instances
aas = boto3.client('application-autoscaling')
aas.register_scalable_target(
    ServiceNamespace='sagemaker',
    ResourceId='endpoint/classifier-production/variant/AllTraffic',
    ScalableDimension='sagemaker:variant:DesiredInstanceCount',
    MinCapacity=2, MaxCapacity=10
)
print(f"✅ Deployed: {predictor.endpoint_name}")
Deployment Strategies
How to ship new model versions without risking production traffic
Blue / Green
Run two identical environments. Blue serves live traffic while Green hosts the new model. Switch instantly after validation — full rollback in seconds.
Canary Release
Send 5% of traffic to the new model. Monitor metrics. Increase to 25%, 50%, 100% if healthy. Limits blast radius for failing models.
A/B Testing
Route traffic by user segment to different model versions. Measure business KPIs and statistical significance before promoting.
Rolling Update
Replace pods one by one in Kubernetes. At each step: new pod up, old pod down. No complete shutdown, gradual capacity transfer.
// Kubernetes Canary Deployment
# stable (v1) — 90% traffic via 9 replicas
apiVersion: apps/v1
kind: Deployment
metadata: { name: ml-api-stable }
spec:
  replicas: 9
  selector:
    matchLabels: { app: ml-api, track: stable }
  template:
    metadata:
      labels: { app: ml-api, track: stable }
    spec:
      containers:
        - name: ml-api
          image: myrepo/ml-api:v1.2.0
          resources:
            requests: { memory: "512Mi", cpu: "250m" }
            limits:   { memory: "1Gi",   cpu: "500m" }
---
# canary (v2) — 10% traffic via 1 replica
apiVersion: apps/v1
kind: Deployment
metadata: { name: ml-api-canary }
spec:
  replicas: 1
  selector:
    matchLabels: { app: ml-api, track: canary }
  template:
    metadata:
      labels: { app: ml-api, track: canary }
    spec:
      containers:
        - name: ml-api
          image: myrepo/ml-api:v1.3.0-rc1
Monitoring & Observability
Your model will degrade — know before your users do
| Category | What to Track | Tool | Alert Threshold | Action |
|---|---|---|---|---|
| Latency | p50, p95, p99 inference time | Prometheus + Grafana | p99 > 500ms | Monitor |
| Throughput | Requests/sec, errors/sec | Prometheus | Error rate > 1% | Monitor |
| Data Drift | Feature distribution shifts | Evidently AI, Whylogs | KL divergence > 0.1 | Alert |
| Model Drift | Prediction distribution change | Evidently AI | PSI > 0.2 | Alert |
| Concept Drift | Accuracy, F1 vs ground truth | Custom + MLflow | Accuracy drop > 5% | Retrain |
| Infrastructure | CPU, memory, GPU utilization | CloudWatch / Datadog | CPU > 80% | Scale |
CI/CD Pipeline for ML
Automate everything from model validation to production promotion
// GitHub Actions — ML CI/CD Workflow
name: ML Model CI/CD
on:
  push:
    branches: [main]
    paths: ['model/**', 'app/**']

jobs:
  validate-model:
    runs-on: ubuntu-latest
    steps:
      - uses: actions/checkout@v4
      - name: Run quality gates
        run: |
          python validate.py \
            --min-accuracy 0.92 \
            --max-latency-ms 200 \
            --test-set data/test.csv

  build-and-push:
    needs: validate-model
    steps:
      - name: Build & push Docker image
        run: |
          docker build -t myrepo/ml-api:${{ github.sha }} .
          docker push  myrepo/ml-api:${{ github.sha }}

  deploy-canary:
    needs: build-and-push
    environment: production
    steps:
      - name: Deploy canary (10% traffic)
        run: |
          kubectl set image deployment/ml-api-canary \
            ml-api=myrepo/ml-api:${{ github.sha }}
      - name: Monitor 5 minutes
        run: |
          sleep 300
          python check_canary_health.py \
            --error-threshold 0.01 --latency-threshold 300

  promote-stable:
    needs: deploy-canary
    if: success()
    steps:
      - name: Promote to stable (100%)
        run: |
          kubectl set image deployment/ml-api-stable \
            ml-api=myrepo/ml-api:${{ github.sha }}
Production Readiness Checklist
Tap each item to mark it complete — don’t ship until all are checked
- Model artifact versioned and stored in a model registry (MLflow, W&B)
- Inference API validates inputs — bad requests return 422, not 500
- Health check endpoint responds in < 100ms and verifies model is loaded
- Container runs as non-root user; no secrets baked into the image
- Resource limits (CPU, memory) defined in Docker Compose / Kubernetes
- Model performance validated on held-out test set before promotion
- Latency benchmarked under expected load (locust or k6)
- Logging structured as JSON — no bare print() statements in production
- Prometheus metrics exposed: request count, latency histogram, error rate
- Grafana dashboards configured with SLA-based alerting
- Data drift monitoring active with alerts routed to on-call
- Rollback procedure documented and tested — rollback achievable in < 5 min
- Auto-scaling configured and tested under 2× expected peak load
- Secrets managed via AWS Secrets Manager or Vault — not in .env files
- CI/CD pipeline enforces quality gates before any production promotion